Key Facts: Market Regime Classification
- Regime count: 6 states (Stable, Clearance, Observation, Elevated, Critical, Breakdown)
- Signal inputs: 30+ across 4 domains (price-technical, institutional, macro, COT)
- Update frequency: Every pipeline run (4x/day on weekdays)
- Framework influences: Wyckoff (accumulation/distribution), Minervini (Stage 2/VCP)
- Dashboard columns: CLEARANCE (enter), OBSERVATION (watch), CAUTION (step away)
- Asset coverage: S&P 100 equities, sector ETFs, indices, commodities, and crypto
- Data sources: Price & volume, 13F whale filings, SEC Form 4 insider data, macro context
What Is Market Regime Classification?
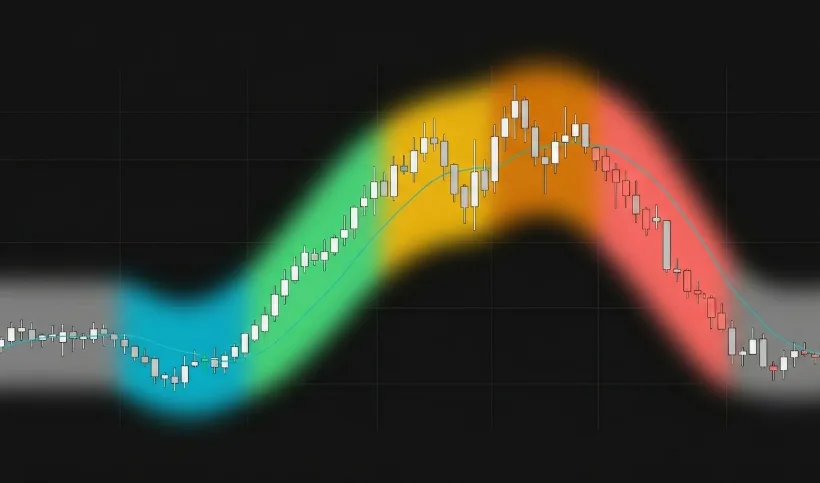
Market regime classification is a systematic framework that assigns every financial asset to one of six structural states — from confirmed uptrend to structural breakdown — based on price structure, volume behavior, institutional positioning, and macro context. Unlike binary "buy or sell" indicators, regime classification provides a continuous diagnostic: it tells the observer what phase the market is in, not what it will do next.
The concept is borrowed from medical triage. In an emergency room, patients are not labeled "healthy or sick." They are classified by urgency: stable, needs monitoring, elevated risk, critical. The classification determines the type of attention required, not the outcome. Market regime classification applies the same logic to financial assets — each of the six states maps to a distinct posture a position trader might adopt.
MarketTriage implements this framework across 308 assets — equities (S&P 100), ETFs (SPY, QQQ, 11 sector SPDRs), indices, commodities, and cryptocurrencies. Every asset is re-evaluated in each pipeline run using 30+ signals, and the regime is stored alongside a conviction score that quantifies the weight of evidence behind the classification.
Think of regime classification as an X-ray of market structure. It does not predict whether a patient will recover — it shows the current structural condition so that the right level of attention is applied. A CRITICAL regime is not a "sell signal." It is a diagnostic observation that multiple exhaustion indicators are present simultaneously at a structural high.
Hover a phase to see what it means · Learn more →
Watch: The 6-State Framework Explained
Prefer watching to reading? This video walks through how the regime framework works in practice — how an asset moves from a quiet base (OBSERVATION) through a confirmed trend (CLEARANCE) into distribution (ELEVATED → CRITICAL) and beyond. The concepts below are all covered here first in visual form.
Published on @MarketTriage on YouTube
Why 6 States Instead of Bullish or Bearish?
Most market regime models use two to four states — typically bull, bear, volatile, and range-bound. These frameworks, often built on Hidden Markov Models or simple moving average crossovers, capture the broad strokes of a market cycle. But they miss the transition zones — and the transition zones are where most capital is made or lost.
Consider the medical analogy: a hospital that classifies patients as only "healthy" or "sick" misses the patients who are deteriorating and those who are recovering — the two groups that need the most attention. MarketTriage's ELEVATED regime captures the deteriorating phase (one crack has appeared at highs, but distribution is not yet confirmed). OBSERVATION captures the recovery phase (accumulation signals are present at lows, but a reversal is not yet confirmed). These are distinct structural states that a binary bull/bear model collapses into noise.
The six-state model also enables per-asset classification. Traditional regime models typically describe "the market" as a whole — the S&P 500 is in a bull regime, or the Nasdaq is in a bear regime. MarketTriage classifies each of its 308 assets independently. During any given week, some equities may be in CLEARANCE while others are in BREAKDOWN. The regime is a property of the individual asset, not the market.
A 2-state model tells a trader whether the market is rising or falling. A 6-state model tells a position trader whether an asset is trending (CLEARANCE), showing early stress (ELEVATED), confirming distribution (CRITICAL), breaking down structurally (BREAKDOWN), accumulating at a base (OBSERVATION), or showing no edge at all (STABLE). The distinction determines whether the appropriate posture is attention, patience, or avoidance.
The 6 Market Regimes
MarketTriage classifies every asset into exactly one of six regimes. The classification is priority-ordered — the system checks for CRITICAL first, then OBSERVATION, then BREAKDOWN, and so on. The first match wins. This means an asset at 52-week highs with three exhaustion signals will be classified as CRITICAL even if it also has bullish trend confirmation — exhaustion at extremes takes priority over momentum.
| State | Color | Trader Intent | Trigger Conditions | Example Archetype |
|---|---|---|---|---|
| CLEARANCE | Green | Confirmed entry | The stock is trending upward with strong supporting evidence from multiple data sources — and no sudden crash has invalidated the trend.Technical: Bullish direction + pre-credit-penalty score ≥ 60 + price above SMA50 + admission=long + no bearish volatility shock | Stage 2 RS leader at breakout |
| OBSERVATION | Blue | Watch / accumulating | The stock is near its lowest price of the year, and early signs suggest institutional buyers may be stepping in. OR multiple hedge funds and insiders are both buying.Technical: At 52W lows: 1 accumulation signal + score ≥ 30. Bearish + within 15% of lows: 2 accumulation signals + score ≥ 30. OR whale + insider both accumulating (bypasses all gates). | Smart-money accumulation at lows |
| ELEVATED | Yellow | Warning — tighten stops | The stock is near its yearly high, but one warning sign suggests the rally may be losing steam.Technical: Near 52W high + criticalCount ≥ 1 + distributionCount ≥ 1 (shape OR confirmed) + score ≥ 30 | Shape-only warning (MU-class) |
| CRITICAL | Orange | Extended — step away | The stock is near its yearly high, and two or more warning signs suggest the rally is running out of fuel.Technical: Near 52W high + criticalCount ≥ 2 + distributionConfirmedCount ≥ 1 (chart-local handoff: RSI/OBV bearish div, wick rejection, volume exhaustion, bearish reversal pattern) | Distribution at highs (confirmed handoff) |
| BREAKDOWN | Coral | Breakdown — exit | The stock is in a confirmed downtrend with no signs of institutional buying to cushion the decline.Technical: Bearish direction + bearishStructuralCount ≥ 1 + (inherentBearishScore ≥ 40 OR (price < SMA50 AND price < SMA200 AND inherentBearishScore ≥ 25)) + no bullish volatility shock | GEHC-style falling-knife breakdown |
| STABLE | Gray | No edge — ignore | No strong signals in either direction. The evidence is mixed or too weak to classify.Technical: No other regime qualifies — score below thresholds or mixed signals | Low-volatility range consolidation |
Priority when multiple regimes qualify: CRITICAL > OBSERVATION > BREAKDOWN > ELEVATED > CLEARANCE > STABLE. First match wins. Source: classifyRegime() in workers/utils/convictionScore.ts.
CLEARANCE — CONFIRMED
Green · Confirmed entry
The stock is trending upward with strong supporting evidence from multiple data sources — and no sudden crash has invalidated the trend.
Technical: Bullish direction + pre-credit-penalty score ≥ 60 + price above SMA50 + admission=long + no bearish volatility shock
Example: Stage 2 RS leader at breakout
Trend confirmed across multiple layers — Mark Minervini's Stage 2 template, volume confirmation, and institutional positioning align. Uses inherent score (before macro penalty) so strong relative-strength leaders remain visible even during credit stress.
OBSERVATION — ACCUMULATING
Blue · Watch / accumulating
The stock is near its lowest price of the year, and early signs suggest institutional buyers may be stepping in. OR multiple hedge funds and insiders are both buying.
Technical: At 52W lows: 1 accumulation signal + score ≥ 30. Bearish + within 15% of lows: 2 accumulation signals + score ≥ 30. OR whale + insider both accumulating (bypasses all gates).
Example: Smart-money accumulation at lows
Richard Wyckoff's accumulation framework in action — OBV divergence, A/D line strength, and volume dry-up at depressed levels. A watchlist signal, not a reversal confirmation. The smart money override (whale 13F + insider Form 4 alignment) is the highest-confidence path to OBSERVATION.
ELEVATED — WARNING
Yellow · Warning — tighten stops
The stock is near its yearly high, but one warning sign suggests the rally may be losing steam.
Technical: Near 52W high + criticalCount ≥ 1 + distributionCount ≥ 1 (shape OR confirmed) + score ≥ 30
Example: Shape-only warning (MU-class)
Early warning. One structural crack has appeared at highs. Not panic — but the first sign to pay attention.
CRITICAL — EXTENDED
Orange · Extended — step away
The stock is near its yearly high, and two or more warning signs suggest the rally is running out of fuel.
Technical: Near 52W high + criticalCount ≥ 2 + distributionConfirmedCount ≥ 1 (chart-local handoff: RSI/OBV bearish div, wick rejection, volume exhaustion, bearish reversal pattern)
Example: Distribution at highs (confirmed handoff)
Multiple exhaustion signals confirm Wyckoff distribution — RSI divergence, volume exhaustion, wick rejection, and OBV distribution at structural highs. Historically precedes significant declines.
BREAKDOWN — BREAKDOWN
Coral · Breakdown — exit
The stock is in a confirmed downtrend with no signs of institutional buying to cushion the decline.
Technical: Bearish direction + bearishStructuralCount ≥ 1 + (inherentBearishScore ≥ 40 OR (price < SMA50 AND price < SMA200 AND inherentBearishScore ≥ 25)) + no bullish volatility shock
Example: GEHC-style falling-knife breakdown
Structural breakdown with no accumulation evidence. The bearish direction is derived from the net weight of directional signals, not SMA position alone.
STABLE — STABLE
Gray · No edge — ignore
No strong signals in either direction. The evidence is mixed or too weak to classify.
Technical: No other regime qualifies — score below thresholds or mixed signals
Example: Low-volatility range consolidation
No actionable edge detected. Low-signal environments where patience is the appropriate response.
Priority: CRITICAL > OBSERVATION > BREAKDOWN > ELEVATED > CLEARANCE > STABLE. First match wins.
See How the Algorithm Classifies Real Assets
This is a snapshot from the live dashboard. Each of these 11 sector funds covers a slice of the market — technology, energy, healthcare, and more. The algorithm assigns each one a regime based on the framework above.

How Conviction Scoring Works
Think of the conviction score as a confidence meter. It adds up evidence from many different sources — price trends, insider buying, institutional holdings, and the broader economy. The more sources that agree, the higher the score. Conflicting signals bring it down. The result is a single number that summarizes how strong the evidence is that something significant is happening.
How the scoring works under the hood
The conviction score is a weighted aggregate of 30+ individual signals — technical indicators, institutional flow data, and macro context — scored on a three-tier point system. It is the quantitative backbone of regime classification: regime rules reference the score to determine whether the weight of evidence crosses a classification threshold.
The scoring pipeline processes signals in a specific order: base signals (each signal earns Tier 1, 2, or 3 points based on its historical reliability) → confluence bonuses (when multiple signals from different domains align — for example, whale accumulation plus insider buying — the combined score exceeds the sum of parts) → regime filter (bullish signals earn 15% more when price is above SMA200, bearish signals earn 15% more when below) → conflict penalty (mixed bullish and bearish signals reduce score) → credit penalty (when macro credit conditions signal risk-off, all scores are penalized by −30 points).
Signal Tier System
Tier 1 (15-40 pts) — Primary structural signals: Golden/Death Cross (40 pts), deep 52W proximity (20-40 pts based on depth), deeply overbought/oversold RSI (15-35 pts based on extremity). These carry the most weight because they reflect long-term structural shifts.
Tier 2 (8-25 pts) — Contributing signals: Bollinger breakouts, volume confirmation, momentum extremes, COT extremes, insider clusters, whale accumulation/distribution, VCP breakouts, relative strength leadership. These add conviction when present but rarely justify a regime on their own.
Tier 3 (5-8 pts) — Contextual signals: Bollinger squeeze, ATR expansion, volume nuances. These provide texture and tiebreaking within regimes — an asset with the same regime and score but higher Tier 3 density has more structural activity.
A conviction score is not a prediction — it is a measurement of the weight of evidence present in the data. A score of 80 does not mean "80% chance of moving up." It means 80 points worth of directional signals are simultaneously active across technical, institutional, and macro layers. The interpretation of that weight depends on the regime context.
Mark Minervini's Stage 2 and VCP Detection
Beyond Richard Wyckoff's accumulation and distribution framework, MarketTriage incorporates Mark Minervini's SEPA methodology (Specific Entry Point Analysis) for equities. Minervini's Stage 2 Trend Template identifies stocks in a confirmed institutional-quality uptrend — the structural sweet spot where price, moving averages, and proximity to highs align.
Stage 2 Trend Template (Equities Only)
An equity qualifies for Stage 2 when all five criteria are met simultaneously: price is above the 50-day moving average, the 50-day is above the 150-day, the 150-day is above the 200-day, the 200-day SMA is rising, price is at least 30% above its 52-week low, and price is within 25% of its 52-week high. When confirmed, the Stage 2 template contributes 15 conviction points (bullish) and replaces the generic "healthy uptrend" as the chart-long signal in protocol admission for equities. This is one of the highest-quality structural filters in the algorithm — stocks meeting all five criteria are, by definition, in a confirmed institutional accumulation phase.
Volatility Contraction Pattern (VCP)
The VCP is Minervini's signature base pattern: a series of progressively tighter price contractions with declining volume, indicating that supply is being absorbed by institutional buyers. MarketTriage detects VCPs algorithmically by dividing the last 40 trading days into four 10-day windows, measuring the percentage range of each, and confirming sequential contraction (each window ≤ 70% of the prior) with declining volume (< 85% of the 50-day average).
A VCP breakout fires when price closes above the pivot high of the tightest contraction window on at least 1.5x average volume — earning 25 conviction points (bullish). When a VCP breakout coincides with a full Minervini Stage 2 template, an additional 15-point confluence bonus is applied. If the asset also leads the S&P 500 on relative strength, another 10-point bonus is added. This combination — VCP breakout + Stage 2 + relative strength leadership — represents one of the highest-conviction entry setups in the entire algorithm.
VCP detection applies to all asset types (equities, ETFs, commodities, crypto). Stage 2 Trend Template is equities-only because the moving average stacking criteria are designed for stocks in institutional accumulation phases. VCP breakouts are not counted toward OBSERVATION thresholds — breakouts are post-base signals, not distress signals.
The Three-Column Triage Board
The MarketTriage dashboard organizes all 308 assets into three columns — CLEARANCE, OBSERVATION, and CAUTION — each mapped to a distinct trader intent. This is not arbitrary grouping: the column an asset appears in reflects both its regime classification and whether it has passed a multi-layer confirmation gate called protocol admission.
CLEARANCE
Intent: Enter
Regime is CLEARANCE or OBSERVATION, AND the asset has passed the 75% protocol admission gate. Multiple signal layers confirm the direction.
OBSERVATION
Intent: Hold / Watch
Active regime signal present (CLEARANCE, OBSERVATION, or ELEVATED) but protocol admission is incomplete. Worth watching — not yet confirmed across all layers.
CAUTION
Intent: Step Away
CRITICAL or BREAKDOWN regime. Multiple exhaustion signals or structural breakdown confirmed. Historically the phase where exposure reduction has been protective.
The protocol admission gate is the layer that separates OBSERVATION from CLEARANCE. An asset in CLEARANCE with a high conviction score still appears in OBSERVATION if it has not passed the 75% threshold across multiple signal categories — technical structure, institutional flow, and macro context. This prevents single-domain signals (for example, a golden cross with no volume confirmation and no institutional backing) from reaching the CLEARANCE column.
Assets classified as STABLE do not appear in any of the three columns. They are displayed in a collapsed grid below the main board — visible on demand but deliberately de-emphasized. In a universe of 308 assets, most will be STABLE at any given time. The dashboard surface area is reserved for assets where the data suggests something is happening.
Smart Money Signals: When Institutions Align
Most regime classification systems rely exclusively on price and volatility data. MarketTriage integrates two additional data layers that most retail traders cannot easily access: SEC Form 4 insider filings and quarterly 13F institutional holdings from 15 tracked institutional filers including Berkshire Hathaway, Bridgewater Associates, Renaissance Technologies, and Pershing Square.
Whale 13F Tracking
Every Friday, MarketTriage scans SEC EDGAR for new 13F-HR filings — the quarterly disclosure required of institutional managers with over $100M in assets. The system parses XML infotables, resolves CUSIP identifiers to ticker symbols, and compares current holdings against prior quarters to detect accumulation (new positions or increased shares) and distribution (reduced or liquidated positions). Whale accumulation contributes 12-20 conviction points (bullish); distribution contributes 12-20 points (bearish). When a whale is accumulating near 52-week lows, an additional 12-point bonus is applied. Read the full 13F whale tracking guide.
Insider Form 4 Clusters
SEC Form 4 filings capture insider transactions — purchases and sales by corporate officers, directors, and 10%+ shareholders. A single insider purchase is noise. Three or more insiders buying within a 90-day window is a cluster — and insider clusters at depressed prices are historically among the strongest predictive signals in equity markets. MarketTriage detects these clusters automatically via daily EDGAR scans.
The Alignment Signal
The most powerful signal in the algorithm is whale + insider alignment: when both institutional whales (via 13F) and corporate insiders (via Form 4) are simultaneously accumulating the same asset. This earns a 25-point confluence bonus and triggers an automatic OBSERVATION classification — bypassing the normal score and proximity gates entirely. The logic: if the people managing billions and the people running the company are both buying, that convergence of informed capital outweighs any price-based indicator.
Richard Wyckoff's volume-price framework explains why smart money alignment matters. During accumulation, large institutions absorb supply gradually — volume declines as sellers exhaust, and price stops making new lows despite persistent bearish sentiment. When On-Balance Volume (OBV) or the Accumulation/Distribution line diverges bullish while price remains flat, it signals that buying pressure is quietly building beneath the surface. The 13F and Form 4 data confirm who is doing the buying.
Gates and Safety Mechanisms
Regime classification is not simply "if score > threshold, assign regime." Between the raw signal data and the final classification, a series of gates filter out structurally unsound classifications. These gates exist because real markets produce signals that, while technically valid in isolation, are misleading in context. A bullish OBV divergence during a collapsing stock is noise — not accumulation. The gates catch this.
| Gate | What It Blocks | Mechanism |
|---|---|---|
| Decline Stability Gate | Premature OBSERVATION during active declines | OBV and A/D divergences only count toward accumulation when ATR is contracting (decline stabilizing). During expanding ATR — active structural breakdown — these flow signals are too noisy to trust. |
| ATR Volatility Shock | CLEARANCE during crash days / BREAKDOWN during spike days | A daily move exceeding ±3 ATR (Chandelier Exit) indicates a regime-invalidating shock. Bearish shocks block bullish classifications. Bullish shocks block bearish classifications. |
| Credit Circuit Breaker | All long protocol admissions system-wide | When HYG/IEF (high-yield to Treasury ratio) falls below its SMA200, credit markets signal risk-off. This applies a −30 point penalty and blocks long admissions across all equities — regardless of individual asset signals. |
| Smart Money Override | Score and proximity gates for OBSERVATION | When both institutional whales (13F filings) and corporate insiders (SEC Form 4) are simultaneously accumulating the same asset, OBSERVATION is granted regardless of conviction score — the highest-confidence human signal in markets. |
Decline Stability Gate
Blocks: Premature OBSERVATION during active declines
OBV and A/D divergences only count toward accumulation when ATR is contracting (decline stabilizing). During expanding ATR — active structural breakdown — these flow signals are too noisy to trust.
ATR Volatility Shock
Blocks: CLEARANCE during crash days / BREAKDOWN during spike days
A daily move exceeding ±3 ATR (Chandelier Exit) indicates a regime-invalidating shock. Bearish shocks block bullish classifications. Bullish shocks block bearish classifications.
Credit Circuit Breaker
Blocks: All long protocol admissions system-wide
When HYG/IEF (high-yield to Treasury ratio) falls below its SMA200, credit markets signal risk-off. This applies a −30 point penalty and blocks long admissions across all equities — regardless of individual asset signals.
Smart Money Override
Blocks: Score and proximity gates for OBSERVATION
When both institutional whales (13F filings) and corporate insiders (SEC Form 4) are simultaneously accumulating the same asset, OBSERVATION is granted regardless of conviction score — the highest-confidence human signal in markets.
Why Gates Matter More Than Signals
Most quantitative trading systems focus on signal generation — the more signals, the better. MarketTriage inverts this: the gates that prevent classification are as important as the signals that trigger it. An asset with five accumulation signals during an active structural breakdown (expanding ATR, price making new lows) is more dangerous than one with zero signals. The decline stability gate catches exactly this scenario.
The credit circuit breaker is the most powerful gate in the system. When the ratio of high-yield bonds (HYG) to Treasury bonds (IEF) falls below its 200-day moving average, it signals that credit markets — which are historically more forward-looking than equity markets — are pricing in deteriorating fundamentals. In this state, MarketTriage blocks all long protocol admissions system-wide. Individual asset signals become secondary to macro credit stress.
Regime Transitions: How Markets Move Between States
A single regime snapshot tells the observer where an asset is now. A regime transition chain tells the story of how it got there — and what typically follows. MarketTriage tracks every regime change in an append-only table, creating a historical record of how assets have moved through the 6-state framework over time.
Transition coherence is a key quality signal. An asset moving CLEARANCE → ELEVATED → CRITICAL follows the natural exhaustion arc: trend confirmed, first warning, distribution confirmed. An asset jumping directly from CLEARANCE to BREAKDOWN — skipping ELEVATED and CRITICAL — would indicate a sudden structural failure (a shock event, earnings collapse, or macro dislocation) rather than a gradual topping process.
Exhausted Rally
CLEARANCEELEVATEDCRITICALBREAKDOWNOBSERVATION
Healthy trend shows first crack (ELEVATED), distribution confirms (CRITICAL), structure fails (BREAKDOWN), then accumulation begins at lows (OBSERVATION).
V-Bottom Recovery
BREAKDOWNOBSERVATIONCLEARANCE
Structural breakdown meets institutional buying. Accumulation signals fire, base forms, and trend re-establishes.
Slow Grind Bear
ELEVATEDBREAKDOWNBREAKDOWNOBSERVATION
Warning appears but no sharp break. Gradual deterioration without capitulation. Eventually, volume dries up and accumulation begins quietly.
Breadth Thrust
BREAKDOWNOBSERVATIONCLEARANCE
A rare Martin Zweig breadth thrust (~3 per decade) fires during breakdown — 10-day EMA of advancing stocks surges from below 0.40 to above 0.615. Historically one of the highest-conviction reversal signals in market history.
Transitions tell a market story. Isolated regime snapshots do not. An asset in OBSERVATION that has been in OBSERVATION for 8 weeks after spending 12 weeks in BREAKDOWN is forming a base — constructive. An asset in OBSERVATION that flipped from BREAKDOWN yesterday after a single bullish candle is noise. The transition history provides the context that a single classification cannot.
Common Mistakes in Regime Interpretation
Market regime classification is a diagnostic tool, and like any diagnostic tool, it can be misread. These are the four most common interpretation errors observed in the MarketTriage framework.
Mistake 1: Treating OBSERVATION as a Buy Signal
OBSERVATION means accumulation signals are present at lows — not that the bottom is in. It is a watchlist classification. Wyckoff accumulation phases (Spring, Sign of Strength, Last Point of Support) often take weeks to complete. Entering at the first OBSERVATION signal is the equivalent of diagnosing a patient as 'recovering' after one improved reading.
Mistake 2: Ignoring Time in Regime
An asset in CRITICAL for one day and an asset in CRITICAL for three months are structurally different. Extended CRITICAL with declining volume suggests exhaustion of the exhaustion — sellers are running out. Brief CRITICAL after a parabolic spike suggests the distribution is just beginning. Duration matters.
Mistake 3: Fighting the Credit Circuit Breaker
When the credit circuit breaker activates (HYG/IEF < SMA200), individual asset signals become unreliable. An asset showing CLEARANCE during a credit risk-off event is like a patient with good vital signs during a hospital-wide power outage — the individual reading may be accurate, but the system context overrides it.
Mistake 4: Confusing Score with Direction
A conviction score of 75 does not mean 'bullish 75.' It means 75 points worth of directional signals are active. The direction is encoded in the signal composition, not the score magnitude. A score of 75 from bearish signals (death cross + volume breakdown + RSI deeply oversold) is aggressively bearish — not 'mostly bullish.'
How MarketTriage Automates Regime Classification
MarketTriage processes 308 assets through its regime classification pipeline automatically — equities (S&P 100 + meme stocks), ETFs (SPY, QQQ, 11 sector SPDRs), indices, commodities, and cryptocurrencies. Each asset is evaluated against 30+ signals from four data engines: CFTC COT data, SEC Form 4 insider filings, institutional 13F whale holdings, and Yahoo Finance OHLCV.
The result is a three-column triage board that separates the 308 assets into CLEARANCE, OBSERVATION, and CAUTION — with STABLE assets collapsed below. Regime transitions trigger alerts via Telegram, and every classification includes a conviction score, severity level, and narrative explanation describing the regime drivers in plain English.
- Pulse Check— Track actual institutional flow data, not Twitter hype.
- Sentiment Extremes— Know exactly when the market has reached peak “Hopium” or panic.
- Beta Status— Lifetime discount on future features
How to Read the MarketTriage Regime Dashboard
The MarketTriage dashboard presents all 308 assets in a three-column layout designed around trader intent — what to pay attention to, what to watch, and what to avoid. Understanding the visual structure accelerates regime interpretation.
Three Columns, Three Intents
CLEARANCE (green) contains assets with a confirmed directional signal — regime is CLEARANCE or OBSERVATION, and the asset has passed the 75% protocol admission gate across multiple data layers. OBSERVATION (blue/yellow) contains assets with active signals that lack full confirmation — CLEARANCE, OBSERVATION, or ELEVATED regime without protocol admission. CAUTION (orange) contains assets where exhaustion or breakdown has been confirmed — CRITICAL or BREAKDOWN regime.
STABLE assets are collapsed at the bottom of the dashboard. These assets show no active signals in either direction — the majority of the 308-asset universe at any given time.
Reading an Asset Card
Each card on the dashboard displays the asset name, regime label (CONFIRMED, WATCH, ACCUMULATING, WARNING, EXTENDED, or BREAKDOWN), current price, and conviction tier (high, moderate, or low). Clicking any card opens a detailed modal with holder and buyer narratives, regime drivers, the data layer protocol status, and a price chart.
Regime Transition Alerts
Above the three columns, an alerts bar displays recent regime transitions — assets that have moved between columns. These transitions are the most actionable events in the system: an asset moving from OBSERVATION to CLEARANCE indicates that protocol admission has been achieved, while a move from OBSERVATION to CAUTION indicates structural deterioration. Alerts include insider trading signals and macro context changes alongside regime transitions.
Regime Classification Approaches Compared
Market regime classification is not a single methodology — it spans academic finance, quantitative strategies, and practitioner frameworks. The foundational academic work is James Hamilton's 1989 regime-switching paper, which introduced Hidden Markov Models to economic time series. MarketTriage builds on this lineage while incorporating practitioner insights from Mark Minervini's SEPA methodology and Richard Wyckoff's volume-price framework.
| Approach | States | Inputs | Latency | Best For |
|---|---|---|---|---|
| MarketTriage 6-State | 6 | Price + volume + institutional + macro | Real-time (4x daily) | Position traders (weeks-months) |
| Hidden Markov Model (HMM) | 2-3 | Returns and volatility | Academic lag | Quantitative strategies |
| Moving Average Crossover | 2 (bull/bear) | Price vs SMA | Real-time but noisy | Trend following |
| Volatility Regimes | 2-3 | VIX / ATR levels | Real-time | Options traders |
| Sector Rotation Model | 4-6 | Relative strength across sectors | Weekly | Asset allocation |
MarketTriage 6-State
States: 6 | Latency: Real-time (4x daily)
Inputs: Price + volume + institutional + macro
Best for: Position traders (weeks-months)
Hidden Markov Model (HMM)
States: 2-3 | Latency: Academic lag
Inputs: Returns and volatility
Best for: Quantitative strategies
Moving Average Crossover
States: 2 (bull/bear) | Latency: Real-time but noisy
Inputs: Price vs SMA
Best for: Trend following
Volatility Regimes
States: 2-3 | Latency: Real-time
Inputs: VIX / ATR levels
Best for: Options traders
Sector Rotation Model
States: 4-6 | Latency: Weekly
Inputs: Relative strength across sectors
Best for: Asset allocation
The key distinction between MarketTriage and academic HMM approaches is input breadth. HMMs typically operate on returns and volatility alone — effective for capturing broad market states but unable to distinguish between an asset declining due to distribution (insiders selling, volume exhaustion) and one declining due to a sector rotation (no fundamental change). The multi-domain input layer — price, volume, institutional flow, and macro context — provides the structural granularity that position traders require.
Market Regime Dashboard Tools Compared
Several products surface a regime view, but they differ sharply in coverage, signal sources, and how many distinct states they expose. The table below compares MarketTriage against the live regime tools that surface most often for the query "market regime dashboard" — QuantMonitor, Swinglytics, and MarketRiskMonitor — across the five dimensions a position trader cares about. Validated 2026-05-06 against each vendor's public marketing pages. Three cells remain unverifiable because the vendor doesn't publicly disclose the capability — we mark those rather than infer.
| Tool | Free Tier | Asset Coverage | Regime States | Signal Sources | Alerts |
|---|---|---|---|---|---|
| MarketTriage | Yes — free tier | 308 assets: S&P 100 equities, 11 sector ETFs, indices, commodities, crypto | 6 (Stable, Observation, Clearance, Elevated, Critical, Breakdown) | Price + volume + COT + Form 4 insiders + 13F whales + macro (HYG/IEF, VIX, breadth, P/C) | Telegram per-user, 6 categories |
| QuantMonitor (quantmonitor.net) | Free membership tier (0 EUR); paid tiers up to 519 EUR/year | MetaTrader 4/5 monitor — venue is forex/futures via MT platform; equity coverage not disclosed | Not publicly disclosed | Methodology described as discretionary edge plus “AI combined with human supervising”; specific signal sources not publicly disclosed | Alert system not mentioned on public pages |
| Swinglytics (swinglytics.com) | Not publicly disclosed | US equities, sector ETFs, indices (SPY, QQQ, DIA, IWM); crypto themes referenced | 3-tier classification (BULLISH / MODERATE / CAUTION) plus a YES / CAUTION / NO trade-decision scale | Technical only — EMA 8/21/50, ADX, RSI, Bollinger Bands, volume expansion, breadth and sector momentum | Alert system not mentioned on public pages |
| MarketRiskMonitor (marketriskmonitor.com) | Public dashboard — no paywall observed | Market-wide / index-level macro factors (no per-asset equity coverage) | 5 verdicts: Risk-On, Neutral, Hedged, Defensive, High Alert | Macro factor model — volatility, credit, breadth | Alert delivery not mentioned on public pages |
MarketTriage
Free: Free tier
Coverage: 308 assets across equities, ETFs, indices, commodities, crypto
States: 6 states
Signals: Price + COT + Form 4 + 13F + macro
Alerts: Telegram, 6 categories
QuantMonitor (validated 2026-05-06)
Free: Free membership; paid up to 519 EUR/year
Coverage: MetaTrader 4/5 monitor (forex/futures); equity scope not disclosed
States: Not publicly disclosed
Signals: Discretionary edge + AI/human supervisor; sources not publicly disclosed
Alerts: Not mentioned on public pages
Swinglytics (validated 2026-05-06)
Free: Not publicly disclosed
Coverage: US equities, sector ETFs, indices (SPY/QQQ/DIA/IWM); crypto themes
States: BULLISH / MODERATE / CAUTION + YES/CAUTION/NO trade scale
Signals: Technical only — EMA, ADX, RSI, BB, volume, breadth
Alerts: Not mentioned on public pages
MarketRiskMonitor (validated 2026-05-06)
Free: Public dashboard, no paywall observed
Coverage: Index-level macro factors (no per-asset equity coverage)
States: 5 verdicts: Risk-On / Neutral / Hedged / Defensive / High Alert
Signals: Macro factor model — volatility, credit, breadth
Alerts: Not mentioned on public pages
The structural difference is signal breadth and disclosure. Among the four tools above, MarketTriage is the only one whose public methodology explicitly combines CFTC COT positioning, SEC EDGAR Form 4 insider filings, and 13F whale holdings with price and macro context inside a single regime classifier. Macro-factor tools like MarketRiskMonitor rank well for "risk-on/risk-off" queries but operate at the index level, not per-asset — and price-technical tools like Swinglytics surface trend strength but not institutional positioning. That smart-money layer is what separates Stage 2 leaders in CLEARANCE from late-cycle distribution in CRITICAL. We re-validate this comparison quarterly; the unverified cells will update if vendors publish.
Frequently Asked Questions
What is market regime classification?
Market regime classification is a systematic framework that categorizes financial assets into one of six risk states — stable, observation, elevated, clearance, breakdown, and critical — based on price structure, volume behavior, and institutional positioning data. Each regime corresponds to a distinct phase in a market cycle.
How many market regimes does MarketTriage use?
Six: STABLE (no edge detected), CLEARANCE (confirmed trend), ELEVATED (early warning at highs), CRITICAL (distribution confirmed with multiple exhaustion signals), BREAKDOWN (structural breakdown below both moving averages), and OBSERVATION (accumulation detected near 52-week lows).
What is a conviction score in trading?
A conviction score is a weighted aggregate of 30+ technical, institutional, and macro signals scored on a Tier 1/2/3 point system. Higher scores indicate stronger directional evidence — not certainty. MarketTriage uses conviction scores as the quantitative backbone of regime classification.
What does OBSERVATION mean in market regime classification?
OBSERVATION indicates that accumulation signals — rising On-Balance Volume, Accumulation/Distribution divergence, volume dry-up — are appearing near 52-week lows. It is a watchlist signal suggesting a potential base formation, not a confirmation of reversal.
How is market regime classification different from technical analysis?
Traditional technical analysis outputs discrete buy/sell signals. Market regime classification provides a continuous diagnostic state for each asset, incorporating institutional flow (13F filings, SEC Form 4), macro context (credit spreads, VIX term structure), and multi-timeframe structure alongside price data.
How often do market regimes change?
Regime transitions depend on structural conditions, not fixed time intervals. An asset may stay in CLEARANCE for months during a steady uptrend, or transition from ELEVATED to CRITICAL in days during a distribution event. MarketTriage re-evaluates every asset during each pipeline run and tracks all transitions in an append-only history table.
What indicators are used for market regime detection?
MarketTriage uses 30+ signals across four domains: price-technical (SMA crossovers, RSI, Bollinger Bands, ATR, candlestick patterns, Minervini VCP), institutional flow (SEC Form 4 insider clusters, 13F whale holdings), macro context (HYG/IEF credit spreads, VIX term structure, Martin Zweig breadth thrust), and CFTC Commitments of Traders positioning data.
How do you know when a market regime changes?
Regime transitions occur when structural conditions shift — not on fixed schedules. An asset might stay in CLEARANCE for months during a steady uptrend, then transition to ELEVATED within days when exhaustion signals appear. MarketTriage tracks all transitions in real time and alerts subscribers to column changes.
What is the difference between a market regime and a trend?
A trend describes price direction (up or down). A regime describes the structural phase of a market cycle — which includes trending periods but also distribution phases, accumulation zones, and breakdown structures that a simple trend label cannot capture.
Can regime classification be used for day trading?
No. MarketTriage's regime classification operates on daily and weekly timeframes, designed for position traders who hold for weeks to months. Intraday price fluctuations are noise within a regime — the classification filters that noise rather than reacting to it.
What is a market regime?
A market regime is the persistent structural state of a market or asset — trending versus range-bound, high versus low volatility, risk-on versus risk-off. Different regimes reward different strategies. MarketTriage classifies every asset into one of six regimes so the trading posture matches current conditions.
How many market regime states does MarketTriage use?
Six. Stable, Observation, Clearance, Elevated, Critical, and Breakdown. Each maps to a Wyckoff cycle phase and a trader intent — observe, hold, watch, warn, exit, breakdown. Priority order resolves overlaps: CRITICAL > OBSERVATION > BREAKDOWN > ELEVATED > CLEARANCE > STABLE.
How is the regime classification calculated?
A multi-signal conviction score combines CFTC COT positioning, 13F whale flows, SEC Form 4 insider clusters, technical signals (RSI, OBV, A/D, candlestick patterns), and macro context (HYG/IEF credit spreads, VIX term structure, breadth thrust, put/call). Computed by classifyRegime() in workers/utils/convictionScore.ts.
How often does the regime update?
Soft regime transitions commit only on end-of-day crons — 16:50 UTC EU close, 21:20 UTC US/Global close, and 10:30 UTC for crypto. The 13:30 UTC intraday cron is price-refresh-only and never commits a regime change, preventing partial-day data from creating flicker.
Can a market regime change suddenly?
Yes. CRITICAL and BREAKDOWN can fire same-day on a confirmed handoff — for example a distribution candle plus RSI bearish divergence plus volume exhaustion. Stable transitions use Schmitt-trigger hysteresis (1.5% enter, 3–7% exit) to prevent regime flicker on routine noise.
Continue Learning
Live Insider Tracker
Live SEC Form 4 cluster feed — clusters overlaid with the 6-state regime context
live data readPosition Trading System
How to synthesise COT, 13F, Form 4, and regime signals into a multi-month thesis
14 min readCOT Report Explained
How institutional futures positioning signals turning points
15 min read13F Filings Explained
Track what the biggest funds are buying and selling
12 min readInsider Trading Signals
When 3+ executives buy their own stock within 90 days
12 min readSmart Money Tracking
COT + 13F + insider flow combined into one signal view
14 min readBest Brokers for Active Traders
Which broker suits regime-based position trading — full cost, execution and regulation comparison
15 min readSee MarketTriage Plans →
For informational purposes only. Historical patterns are not indicative of future results. This is not financial advice. MarketTriage provides observational analysis of publicly available market data and does not offer directional trade recommendations. Regime classifications are diagnostic observations, not actionable instructions.