
What Is the CFTC Commitment of Traders Report?
The Commitment of Traders (COT) report is a weekly disclosure published by the Commodity Futures Trading Commission (CFTC) — the US federal agency that regulates futures and options markets. Every Tuesday, the CFTC collects the positions of every trader holding above a minimum reporting threshold. Every Friday at 3:30 PM Eastern Time, that data is published publicly.
The report has existed in various forms since 1924 and in its modern, digital form since 1986. It covers futures markets across commodities (Gold, Oil, Corn), financial instruments (S&P 500 futures, Treasury Bonds), and currencies (EUR/USD, JPY/USD). The data is free and publicly available. The problem is not access — it is interpretation.
Think of the COT report as a weekly X-ray of the futures market. It does not tell you what the price will do. It shows you who is positioned where — and history shows that the positioning of certain participants has strong predictive value for long-term reversals.
The Three Market Participants: Who Is Actually Moving Markets?
The CFTC sorts every reporting trader into three categories — Commercial Hedgers, Large Speculators, and Small Speculators — based on a mandatory declaration of business purpose. Each category has a fundamentally different motivation for trading, and that motivation is what gives COT positioning its predictive power.
Vocabulary note: You'll see these called "Commercials" and "Large Speculators" in official CFTC data — they're the same groups we call "Smart Money" and "Trend-Chasing Funds" in our weekly digest. These are the same institutional groups tracked through SEC Form 4 insider cluster signals on the equity side.
| Category | Who They Are | Primary Motivation | Market Behaviour |
|---|---|---|---|
| Commercial Hedgers (Smart Money) | Producers, processors, merchants (e.g. oil refiners, wheat farmers) | Hedging real-world exposure | Contrarian — sell at highs to lock in profits, buy at lows to secure inventory |
| Large Speculators (Trend-Chasing Funds) | Hedge funds, managed money, institutional investors | Directional profit | Trend-following — add to winning positions, concentrated at market peaks |
| Small Speculators (The Retail Crowd) | Retail traders below CFTC reporting thresholds | Speculation | Often wrong at extremes — most bullish at tops, most bearish at bottoms |
Commercial Hedgers (the "Smart Money"): Hedgers, Not Predictors
Commercial Hedgers deal with the physical reality of supply and demand. A gold mining company that sells futures to lock in a price for next quarter's output is a Commercial. A wheat farmer who shorts corn futures ahead of harvest is a Commercial. Their positioning is considered the most informed signal in the COT report — but with an important nuance.
Commercials are not necessarily predicting that price will fall when they short. A gold miner who shorts at $2,500/oz is not calling a top — they are locking in a price that makes their mine profitable for the next 12 months. They would be "happy to be wrong" if gold rallies further, because their physical inventory is worth more. This means Commercials can remain heavily short through an entire bull market, and often do. The signal is not that price will reverse — it is that the risk-reward of chasing the trend has deteriorated from the perspective of those who know the fundamentals best.
Large Speculators (Trend-Chasing Funds): The Trend Followers
Hedge funds and managed money firms — the Large Speculators — use sophisticated algorithms to capture trend momentum. They are not wrong about direction, but they are systematically late. They pile into trends after momentum is established, often concentrating positions precisely when the trend is most exhausted. When Large Speculators reach an all-time net long position, it is not a signal to join them. It is often the opposite.
Small Speculators (the Retail Crowd): A Liquidity Signal, Not Just a Sentiment Signal
Small Speculators — retail traders and small funds below the CFTC reporting threshold — are often described as "wrong at extremes," but understanding why is more useful than the observation alone. Small Speculators are typically under-capitalised and highly leveraged. When they reach a net long extreme, thousands of accounts are holding positions near their maximum risk tolerance.
This creates a liquidity trap. If price ticks down even modestly, cascading margin calls force involuntary liquidation — accelerating the move against them. The extreme positioning is not just a contrarian sentiment signal; it is a structural fragility signal. The "weak hands" are fully loaded, and their stop-losses become fuel for the reversal.
The Data Lag: Why Three-Day-Old Data Still Works
The COT report's three-day publication lag — Tuesday close to Friday 15:30 ET — is exactly why it powers swing trading but fails for day trading. This is a macro-level instrument, not an intraday timing tool.
The value of the data does not come from any single week's reading. It comes from the trend of institutional positioning over multiple weeks — particularly when that trend approaches historical extremes. A single week's change in commercial shorts is noise. A 12-week trend of commercials aggressively adding longs is a diagnostic signal.
Analogy: A doctor does not diagnose a patient from a single blood test. They look at whether values are trending toward dangerous thresholds over time. COT analysis works the same way.
Extreme Positioning Events: When the COT Report Issues a Warning
When hedge funds get loaded more than 2 standard deviations above their 3-year normal — roughly the top 2.5% of all weeks on record — markets often turn. Statisticians call this a z-score above +2.0 (or below −2.0 for the opposite extreme), measured across a 156-week window. At these levels, a trader category's net position has reached a 3-to-5-year peak or trough — historically preceding major reversals in gold, crude oil, and equity index futures.
| Scenario | Speculator Action | Commercial Action | Historical Pattern |
|---|---|---|---|
| Bullish Extreme | 5-Year High Longs | 5-Year High Shorts | Potential market top — crowded trade, limited buying pressure remaining |
| Bearish Extreme | 5-Year High Shorts | 5-Year High Longs | Potential market bottom — institutional accumulation at depressed prices |
Historical Examples
Each of the positioning extremes below also triggered major regime transitions in the weeks that followed — a pattern the MarketTriage classifier is built to detect.
- Gold, February 2020 — 473,200 contracts. Speculative longs hit a record five-year extreme just as COVID arrived. When selling started, there was no one left to buy — a sharp liquidation event followed as markets deleveraged.
- Crude Oil, August 2007 — nine months before the top. Researchers identified a significant decline in Producer Short positions well before crude peaked in mid-2008. Commercial Hedgers were quietly reducing hedges before the public understood the supply dynamic.
- Agricultural Futures, 1970s and 1990s. Major wheat, corn, and soybean price spikes were each characterised by extreme Commercial short positioning as farmers and processors aggressively locked in elevated prices — a signal that the insiders viewed the rallies as unsustainable.
- WTI Crude, November 2021 — crowded long extreme. Managed Money WTI net long ran near multi-year highs while Commercials sat near multi-year shorts. Crude continued to grind higher into spring 2022, but the structural fragility was already in place — front-month WTI peaked above $120 in June 2022 and lost roughly a third of its value by year-end. (Source: CFTC Disaggregated Futures-Only)
- Gold, July 2020 — speculative pile-in at the top. Managed Money Gold net long hit a multi-year extreme as the post-COVID safe-haven trade became crowded. Gold made an all-time high near $2,089/oz in early August 2020 and then spent the next 15 months in a 20% drawdown — the textbook outcome when the late-arriving fund flow has no marginal buyer left. (Source: CFTC Disaggregated Futures-Only)
- Nasdaq E-mini Futures, Q1 2023 — Leveraged Funds piled in. Reported under the Traders in Financial Futures (TFF) format, Leveraged Funds built a heavy net long in NQ futures through early 2023 alongside the AI-driven tech rally. The Nasdaq 100 then corrected roughly 10% between July and October 2023 before resuming its trend — a reminder that crowded positioning compresses risk-reward even when the underlying thesis is correct. (Source: CFTC TFF Futures-Only)
Worked Example: Gold COT at the 2022 Bottom
Between June and November 2022, Commercial Hedgers in Gold systematically reduced their net short position from roughly −200,000 to −75,000 contracts — a 156-week z-score that climbed from +0.5 to +1.6 — while Managed Money flipped from a net long of +57,500 contracts to a net short of −41,400 contracts. Speculators were selling into the late-2022 weakness; Commercials were quietly covering. The reversal followed: Gold rallied from the $1,645 low on November 1, 2022 to $1,930 by January 31, 2023 — a roughly 17% move in three months — and Managed Money was forced back to a +84,400 net long position at the peak of the rally.
| Tuesday Date | Commercial Net | Managed Money Net | Z-Score (Comm, 156w) | Gold Spot | What It Meant |
|---|---|---|---|---|---|
| Jun 7, 2022 | −199,886 | +57,531 | +0.52 | $1,848 | Speculators net long; Commercials heavily short. Mid-range positioning for the cycle. |
| Aug 2, 2022 | −135,565 | +15,855 | +1.15 | $1,771 | Commercials cover shorts as Gold weakens; Managed Money long position thinning. |
| Sep 6, 2022 | −114,064 | −6,962 | +1.32 | $1,700 | Managed Money flips to net short. Commercials at 1.3σ less short than 3-year average. |
| Oct 4, 2022 | −96,548 | −6,875 | +1.39 | $1,721 | Commercial net short reaches a 3-year low. Setup forming, not yet confirmed. |
| Nov 1, 2022 | −74,782 | −41,401 | +1.55 | $1,645 | Peak divergence — Managed Money heavily net short, Commercials least short in 3 years. |
| Jan 31, 2023 | −180,520 | +84,447 | +0.21 | $1,930 | Reversal confirmed. Managed Money forced back to net long; Gold +17% off the Nov 1 low. |
| Mar 14, 2023 | −155,440 | +59,721 | +0.43 | $1,906 | Trend continues — positioning normalising as Gold consolidates near 1-year highs. |
Source: CFTC Disaggregated Futures-Only report, Gold (Commodity Exchange Inc.). Commercial Net = Producer/Merchant + Swap Dealer (long − short). Z-score computed over the trailing 156-week window, excluding the current observation. Gold spot prices from front-month COMEX Gold futures (GC=F) close on each Tuesday CFTC report date.
The setup did not announce itself in any single week. The signal was the four-month trend: Commercials accumulating into weakness, Managed Money exiting longs and adding shorts, z-score climbing toward but never quite reaching the +2.0 textbook threshold. Position traders who waited for the z-score to print +2.0 missed the entry; those who read the trajectory positioned ahead of it.
Live Example: Two Extremes, One Week
Both scenarios — bullish extreme and bearish extreme — can occur simultaneously in different markets. The gauges below show current institutional positioning for Bitcoin and Silver, drawn from the latest COT report. One market sits near a three-year high in speculative longs. The other sits near a three-year low.
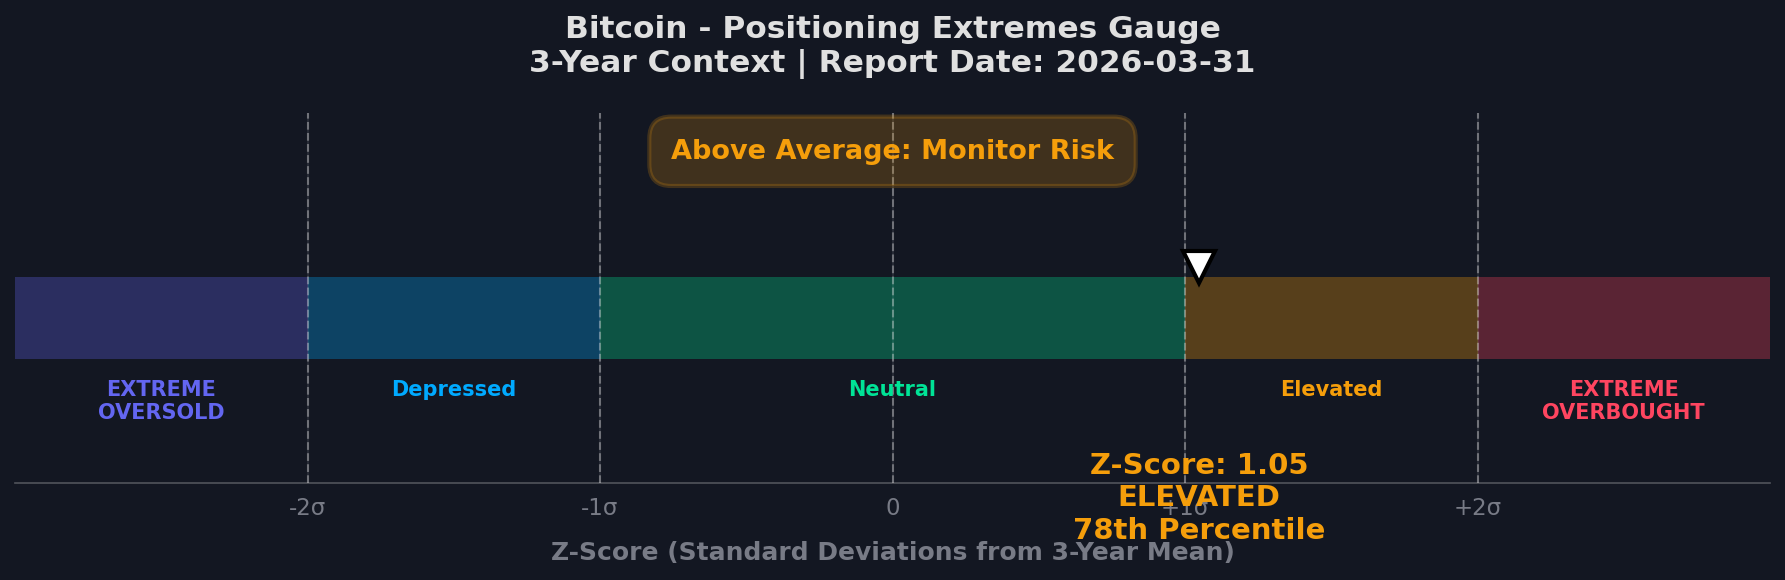
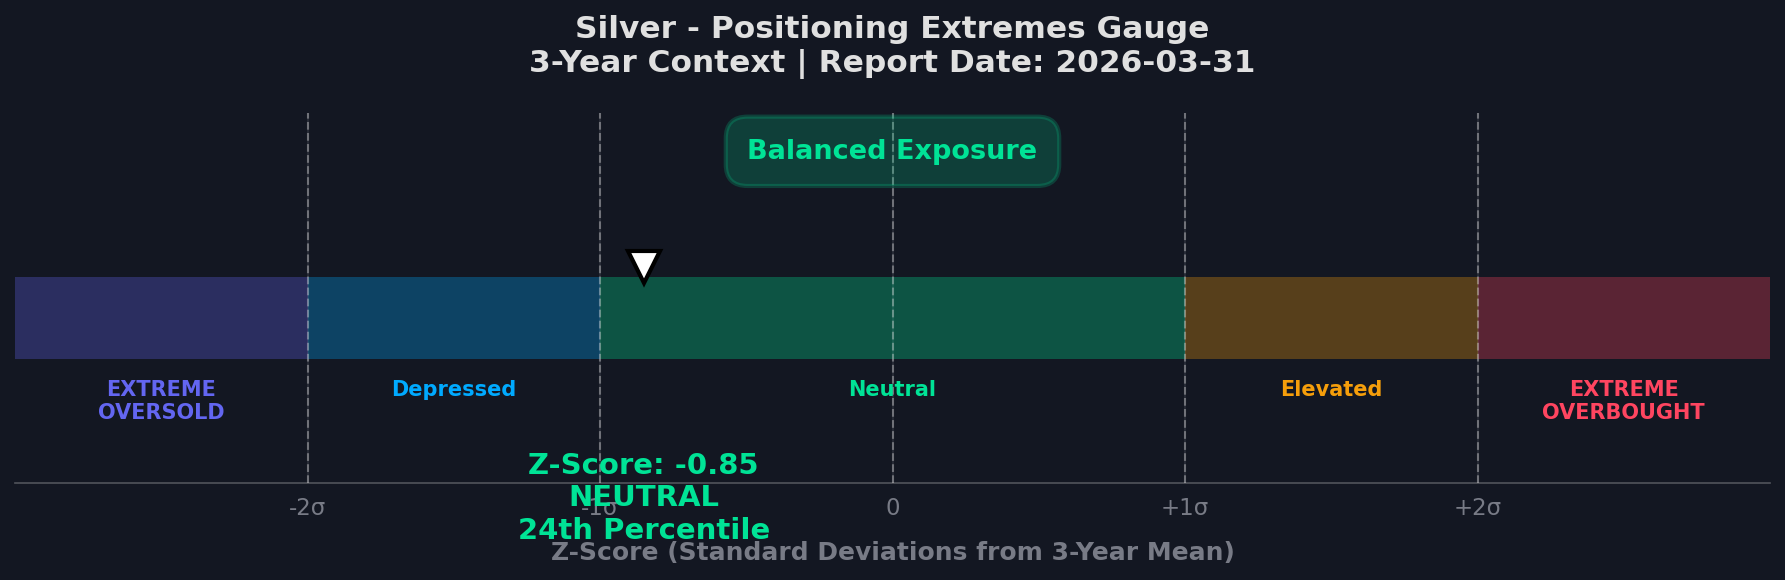
Live gauges — updated every Saturday from CFTC COT data.
How to Read a COT Report in 5 Steps
Once the raw report is in front of you — Legacy, Disaggregated, or TFF — the interpretation work is the same regardless of asset class. The framework below turns five columns of contract counts into an actionable read in roughly ten minutes per market. It assumes you already have the report open (or a tool that displays it); for downloading the raw file directly from the CFTC, see Section 13.
Identify the net position per category
Subtract Short contracts from Long contracts for each trader category — Commercial Hedgers, Large Speculators (Managed Money in Disaggregated reports), and Small Speculators. The net number reveals which side of the market each group is positioned on, and by how much. Raw long-and-short totals in isolation say almost nothing.
Normalise the net position to a z-score
Compare the current net position to its 156-week (3-year) mean and standard deviation. The z-score formula is (current net − 3-year mean) ÷ 3-year standard deviation. A z-score above +2.0 or below −2.0 marks a historical extreme — the top or bottom 2.5% of all readings. Without normalisation, raw contract counts cannot be compared across markets or across years.
Look for divergence between Commercials and Large Speculators
The actionable setup is when the two groups reach opposite extremes simultaneously — Managed Money at a 3-year net long extreme while Commercials are at a 3-year net short extreme (or vice versa). One group alone being extreme is information; both being extreme in opposite directions is the higher-probability signal.
Anchor the signal to price context
A COT divergence carries more weight when price simultaneously reaches a technical level — a 52-week high or low, a major moving average (weekly 50- or 200-EMA), or a prior support / resistance zone. Positioning is the why; price structure is the when. Without a price-level confirmation, the divergence is a probability statement, not a timing signal.
Repeat weekly and watch the trend
Single-week prints are noise. The signal is the trend over four or more consecutive weeks — Commercials systematically reducing shorts against a falling price, or Large Speculators steadily accumulating into a rally. The weekly cadence of the report is structural; the weekly review of the trend is the user-side discipline.
The framework intentionally avoids predictions. COT data describes who is positioned where right now; it does not say which Tuesday the reversal will print. The five steps are diagnostic, not directional — they identify when the structural conditions for a reversal are in place, and the price-context anchor (Step 4) is what converts that condition into a tradable signal.
The Raw Data Problem: Why Most Traders Cannot Use COT Directly
The CFTC's weekly spreadsheet contains over 2,000 rows of raw contract counts across 100+ markets and three report types. This is where most retail traders stop. The numbers are meaningless without historical context — a net long of 100,000 contracts can be extreme in one market and mid-range in another.
Absolute vs. Relative Positioning
A net long position of 100,000 contracts in Gold futures may sound large. But if the five-year historical range for that metric is 80,000 to 200,000, then 100,000 actually sits close to the bearish end of the spectrum — not the bullish end. Without normalisation, the number tells you nothing.
Back-Adjustment and Contract Consolidation
The introduction of E-mini and Micro futures contracts complicates long-term comparisons. A Micro E-mini S&P 500 contract (/MES) is one-tenth the size of the standard E-mini (/ES). Analysts must convert all positions to "full-contract equivalents" before comparing across years. Without this adjustment, a five-year COT chart is statistically compromised.
The Z-Score Solution
The industry standard for normalising COT data is the COT Index (popularised by traders like Larry Williams) and Z-Score normalisation. These methods place current positioning on a standardised scale — 0 to 100%, or standard deviations from the mean — relative to a defined historical window. The result: a single comparable number regardless of absolute contract counts.
The MarketTriage Severity System: COT Data Without the Spreadsheet
MarketTriage classifies each of 11 COT-tracked markets into one of four severity tiers — NEUTRAL, WATCH, ALERT, or CRITICAL — using 156-week z-score normalisation plus full-contract back-adjustment. The result lands in your inbox every Saturday morning after the CFTC report drops Friday afternoon.
| Signal | Institutional Status | Analytical Interpretation |
|---|---|---|
| NEUTRAL | Historical Average | No significant institutional bias. Price action is likely driven by short-term noise. |
| WATCH | Trending Toward Extreme | Institutional accumulation or distribution is beginning to manifest. A potential trend is forming. |
| ALERT | Historical Extreme (3-Year) | Positioning has reached a level that has historically preceded major reversals. Caution is warranted. |
| CRITICAL | All-Time / 5-Year Extreme | The trade is severely crowded or Commercials are at maximum hedging. High probability of regime shift. |
Here is what this looks like on a live asset. This Natural Gas signal was captured directly from the MarketTriage dashboard:
Live Example — Natural Gas Signal
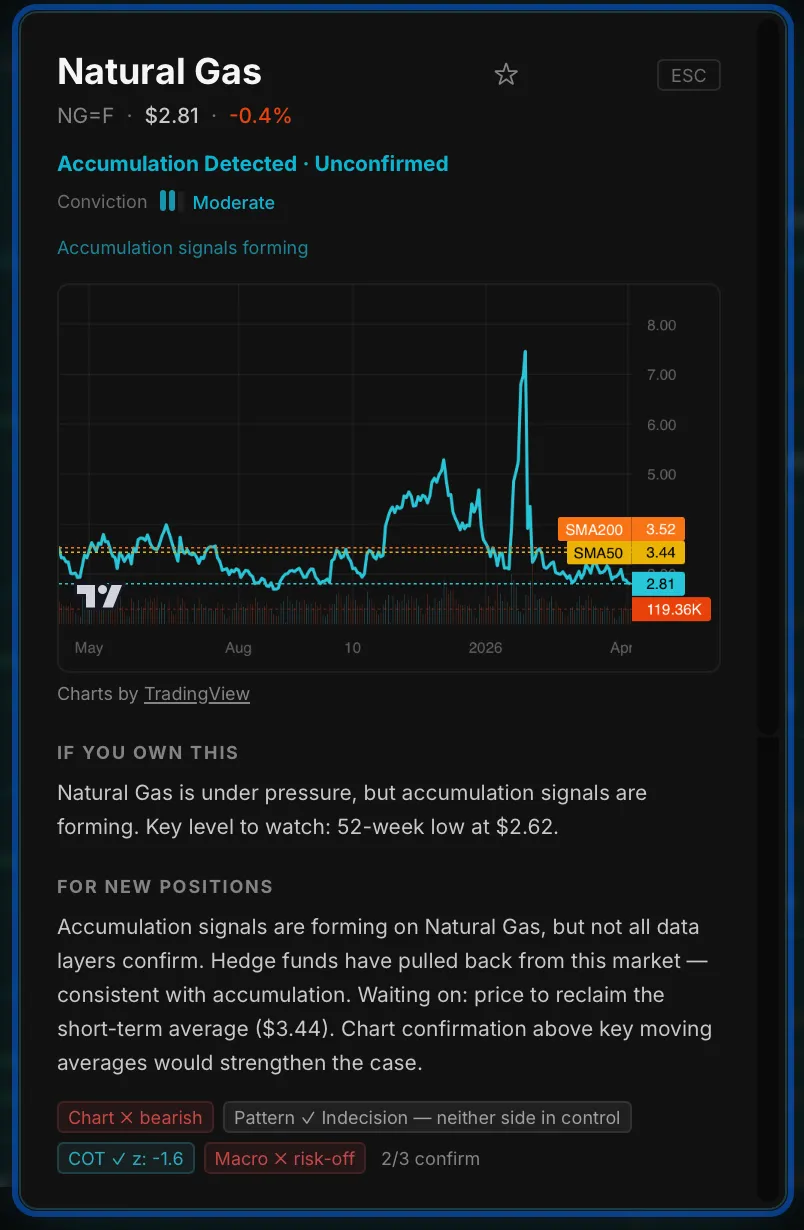
Natural Gas is showing COT z: −1.6 — hedge funds are underweight, positioned further short than 84% of historical readings. The data layer badges at the bottom tell the full story: Chart is bearish (price below both SMAs), but COT and Pattern both confirm accumulation signals. Two of three independent layers agree. MarketTriage surfaces this conflict automatically every Saturday after the CFTC report drops — the kind of setup that raw spreadsheet data buries in thousands of rows.
Open Natural Gas COT signal →Free Beta Access
Receive COT severity signals every Saturday. No spreadsheet required.
Join traders already receiving the weekly MarketTriage digest — institutional intelligence, plain language, inbox delivery.
- Pulse Check— Track actual institutional flow data, not Twitter hype.
- Sentiment Extremes— Know exactly when the market has reached peak “Hopium” or panic.
- Beta Status— Lifetime discount on future features
Confluence: Why COT Data Works Best as Part of a System
In February 2020, Gold speculative longs hit a +2.3 z-score extreme — but the reversal only confirmed once price broke below the weekly 20-EMA and Commercials were already accumulating. Three layers aligned, not one. That is the rule: COT signal reliability jumps sharply when two or more independent data layers align — positioning extreme plus price structure break plus 13F institutional flow. Because of the three-day lag, a standalone COT reading is a probability statement, not a timing signal. Confluence analysis solves this.
A MarketTriage CRITICAL designation carries more weight when it occurs simultaneously with a price break of a major weekly trendline, a divergence in a momentum oscillator, and corroborating institutional signals — such as 13F whale accumulation or insider buying clusters confirming the same directional thesis. Independent signals pointing to the same conclusion reduce the probability that any single data point is a statistical anomaly.
MarketTriage applies this principle systematically — the 6-state regime classification framework combines COT positioning with technical structure, institutional flow, and macro context into a single diagnostic state for each asset.
Which Markets Have the Strongest COT Signals?
Gold, Silver, Crude Oil, and the major agricultural grains produce the most reliable COT signals — these are markets with large, clearly defined Commercial Hedger groups (miners, oil producers, farmers) whose hedging motivation is transparent and driven by physical supply. On the equity side, the same institutional flow is tracked alongside 13F whale exposure. Equities and currencies rank lower in COT reliability because participant motivations are more mixed.
| Market | Best Report | Signal Reliability | Notes |
|---|---|---|---|
| Gold / Silver | Legacy / Disaggregated | Very High | Distinct commercial hedger groups; reversal signals historically reliable |
| Crude Oil | Disaggregated | High | Producer hedging clearly visible; precedes major price shifts |
| Corn / Wheat / Soybeans | Legacy | High | Seasonal commercial cycles make patterns predictable |
| S&P 500 Futures | Disaggregated | Moderate | Managed Money extremes signal late-cycle speculation |
| EUR/USD, JPY/USD | TFF | Moderate | Macro trend confirmation for swing traders |
| Treasury Bonds (10Y/30Y) | TFF | Moderate | Institutional inflation/growth expectations |
| Bitcoin Futures (BTC/CME) | Disaggregated | Emerging | Since BTC ETF launch: clear Institutional vs. Retail divergence, increasingly reliable for macro positioning |
Case Study: Two Markets, Two Opposite Signals
On February 17, 2026, a single CFTC release produced two diametrically opposite calls: Gold flashed a crowded-long warning while Bitcoin showed institutional accumulation under retail caution. Same framework, same date, opposite signals — the charts below show exactly how that read works.

Speculators ~75 (elevated), Commercials near lows. Crowded long — structurally fragile if price weakens.

Commercials ~65 (dominant), Speculators ~25 (low). Accumulation Divergence — institutional positioning ahead of retail.
Same framework, same date, opposite signals. Gold shows a crowded speculative trade with Commercial resistance. Bitcoin shows institutional accumulation while retail is still cautious. This is COT analysis at its most practical — not a forecast, but a diagnostic of who is positioned where.
Source: CFTC data · Visualized by ChartLense.com
Common Pitfalls: What Beginners Get Wrong
Pitfall 1: Don't trade the signal — trade the confirmation.
COT tells you when a trade is crowded, not when it will flip. Speculators can hold extreme positions for months before price reacts. Wait for at least one of: a weekly Shooting Star or Hammer at a key level, a close through the 20-period weekly EMA, or a weekly RSI divergence. Each independently confirms price is responding to the structural fragility COT already flagged.
Pitfall 2: Raw contract counts are meaningless — only z-scores matter.
A Gold Commercial short of 200,000 contracts can be a five-year extreme in one era and mid-range in another. Reading raw CFTC spreadsheets without normalising to a 156-week historical range is reading a thermometer without a scale. Use the COT Index (0-100%) or z-score (standard deviations from mean) — never the absolute number.
Pitfall 3: COT is a weekly swing-trade tool — never a day-trade tool.
COT updates once per week with a three-day lag. A market can register CRITICAL for two-to-four weeks while oscillating violently intraday. COT identifies the structural backdrop — not the precise entry. Day traders looking for intraday timing here will find no edge.
Pitfall 4: Watch for CFTC reporting gaps.
COT reporting depends on US government operations. During shutdowns or data incidents (such as the 2023 ION Markets cyber event), the report can be delayed or suspended for weeks. Traders relying exclusively on COT during these periods lose institutional visibility entirely. MarketTriage flags reporting gaps explicitly in the weekly digest.
Your 10-Minute Weekend Routine
The CFTC drops the COT report Friday at 15:30 ET; MarketTriage processes all 11 tracked markets overnight so the digest lands in your inbox by Saturday 09:00 ET. Here is a four-step, ten-minute routine to integrate it into weekend prep before markets open Monday.
Every Weekend — 10 Minutes
- 01Open your MarketTriage digest — check which markets have moved to WATCH, ALERT, or CRITICAL since last week.
- 02For any CRITICAL market, pull up the weekly chart. Look for the three price confirmation triggers: EMA position, candle pattern, RSI divergence.
- 03Set a price alert on any CRITICAL market where at least one confirmation trigger is forming — not yet triggered, but forming.
- 04Review any NEUTRAL markets that were previously elevated. A return to NEUTRAL after a CRITICAL reading is a meaningful deescalation — the structural pressure has resolved.
How to Access COT Data from the CFTC
All COT data is free at cftc.gov — no account, no paywall, available every Friday by 15:30 ET. The following six steps walk through how to find, read, and interpret the raw Legacy or TFF report directly from the primary source.
Go to the CFTC COT reports page
Navigate to cftc.gov/MarketReports/CommitmentsofTraders. This is the primary source for all COT data.
Choose your report type
Select Legacy for physical commodities (gold, oil, agricultural). Select Traders in Financial Futures (TFF) for financial contracts (S&P 500, Nasdaq, currencies, Treasuries).
Select "Short Format"
The Short Format presents a readable table layout. The Long Format includes concentration ratios and additional breakdowns — useful for advanced analysis but not necessary for beginners.
Find your market by contract name
Scroll or search for the specific contract (e.g., "GOLD - COMMODITY EXCHANGE INC." or "E-MINI S&P 500 - CHICAGO MERCANTILE EXCHANGE"). Each market has its own row.
Read the key columns
Focus on Noncommercial Long, Noncommercial Short (Large Speculators), Commercial Long, Commercial Short (Hedgers), and Nonreportable (Small Speculators).
Calculate net positioning
Noncommercial Long minus Noncommercial Short = Net Speculative Position. A large positive number means speculators are heavily long. A large negative number means they are heavily short.
For the full methodology, see the CFTC's explanatory notes.
COT Report Types Compared
The CFTC publishes three COT formats — Legacy, Disaggregated, and Traders in Financial Futures (TFF) — each tuned for a different asset class. Use Legacy for commodities, TFF for S&P 500 and currencies, Disaggregated when you need the Producer-vs-Swap-Dealer split.
| Report Type | Covers | Trader Categories | Best For |
|---|---|---|---|
| Legacy | Physical commodities | Commercial / Large Spec / Small Spec | Gold, oil, copper, agricultural |
| Disaggregated | Physical commodities (expanded) | Producer / Swap Dealer / Managed Money / Other | Deeper supply chain analysis |
| TFF (Traders in Financial Futures) | Financial contracts | Dealer / Asset Manager / Leveraged Funds / Other | S&P 500, Nasdaq, currencies |
COT Analysis Tools Compared
We compared six COT tools head-to-head — CFTC.gov, Barchart, CotBase, InsiderWeek, SpreadCharts, and MarketTriage. Only one combines 156-week z-score positioning with multi-signal integration (COT + 13F + insider flow). The table below maps each.
| Tool | Focus | Free | Z-Score | Multi-Signal |
|---|---|---|---|---|
| CFTC.gov | Raw data (primary source) | Yes | No | No |
| Barchart | COT charts + data | Yes | No | No |
| CotBase | COT visualization | Partial | Yes | No |
| InsiderWeek | COT + education | Partial | Yes | No |
| SpreadCharts | COT + seasonal | Partial | Yes | No |
| MarketTriage | 11 COT assets + signals | Yes (beta) | Yes (156-week) | Yes |
MarketTriage is free during the open beta. See pricing tiers for post-beta plans covering real-time alerts, extended asset coverage, and API access.
Frequently Asked Questions
What is the COT report?
The Commitments of Traders (COT) report is a weekly CFTC release showing how Commercial Hedgers, Large Speculators, and Small Speculators are positioned in U.S. futures markets. Published every Friday at 3:30 PM ET, it uses Tuesday's data to reveal who is long, who is short, and by how much.
When is the COT report released?
The CFTC releases the COT report every Friday at 3:30 PM Eastern Time (20:30 UTC), reflecting positions at the prior Tuesday's close. If Friday is a U.S. federal holiday, the release shifts to Monday. The three-day gap between data and publication is structural, not a delay.
Is the COT report a leading or lagging indicator?
The COT report is a lagging indicator by roughly three days — Tuesday's positions publish Friday at 15:30 ET. It works best as confirmation and sentiment context, not entry timing. Extremes in Large Speculator positioning have historically preceded major reversals by 4 to 12 weeks across gold, crude, and equity index futures.
What is the difference between Commercials and Large Speculators in the COT report?
Commercials are physical producers, processors, and merchants who hedge real-world exposure. Large Speculators are hedge funds trading purely for directional profit. Commercials act as smart money — their positioning reflects fundamental supply-demand knowledge — while Large Speculators are trend-followers who often concentrate late at market peaks.
How often is the COT report published?
The CFTC collects positioning data at Tuesday's close every week. The report publishes every Friday at 3:30 PM Eastern Time, creating a three-day data lag. The report reflects Tuesday's positions, not Friday's live market conditions.
What is an extreme positioning event in COT analysis?
An extreme positioning event occurs when a trader category's net position reaches a 3-to-5-year historical peak or trough. Speculators at 100% net long signals a crowded trade — no new buyers remain. Commercials at extreme longs historically signals institutional accumulation at undervalued prices.
Is COT analysis suitable for day trading?
No. COT data is a weekly macro indicator best suited for swing trades held weeks to months. Weekly data with a three-day lag cannot time a one-minute chart entry — the decision frequency does not match the data frequency.
What markets have the strongest COT signals historically?
Precious metals (Gold, Silver), energy (Crude Oil), and agricultural futures (Corn, Wheat, Soybeans) historically produce the most reliable COT signals due to large, distinct commercial hedger groups. S&P 500 and EUR/USD are tracked via the Disaggregated and TFF reports respectively.
What does the COT report tell you?
The COT report shows how hedge funds, commercial hedgers, and money managers are positioned in US futures markets. It reveals extreme positioning — crowded trades where one side has become structurally overloaded. These extremes have historically preceded major reversals in commodities, indices, and currencies.
What is a COT index or z-score?
A COT index or z-score is a statistical measure comparing current positioning to a 3-year (156-week) historical range. A z-score above +2.0 indicates extreme net longs — historically a bearish contrarian signal. Below -2.0 indicates extreme net shorts — historically bullish.
Which COT report type should I use?
Use the Legacy report for physical commodities like gold, oil, and copper. Use the Traders in Financial Futures (TFF) report for S&P 500, Nasdaq, and currency pairs. Use the Disaggregated report for deeper supply-chain analysis — it splits Commercials into Producer and Swap Dealer subcategories.
Can you use COT data for stock trading?
Yes, through E-mini S&P 500 and Nasdaq Mini futures contracts reported in CFTC data. Large Speculator positioning in these contracts reflects institutional equity sentiment and historically signals late-cycle speculation at market peaks. MarketTriage maps this data to the S&P 500 and Nasdaq indices automatically.
How do you read a COT report?
Open the CFTC report at cftc.gov, select Legacy or TFF format, and find your contract. Focus on five columns: Noncommercial Long/Short (Large Speculators), Commercial Long/Short (Hedgers), and Nonreportable (Small Speculators). Subtract shorts from longs to get each category's net position.
What is a good COT z-score?
A COT z-score measures how current positioning compares to its 3-year mean in standard deviations. Readings above +2.0 or below -2.0 mark historical extremes — the top or bottom 2.5% of readings. These are the thresholds where COT historically signals potential reversals.
Is the COT report accurate?
Yes — the CFTC collects data directly from clearing members and futures commission merchants, making it highly reliable. The limitation is timing: data reflects Tuesday's close but publishes Friday at 3:30 PM ET. Accuracy is not the issue; the three-day lag is.
What time does the COT report come out on Friday?
The CFTC publishes the Commitment of Traders report every Friday at 3:30 PM Eastern Time (20:30 UTC). If Friday is a US federal holiday, the release shifts to Monday. The data reflects positions at the prior Tuesday's close.
Who uses the COT report?
Position traders, commodity trading advisors (CTAs), macro hedge funds, bank research desks, and institutional allocators use the COT report. Academic researchers also cite it when modelling futures-market positioning. Retail swing traders use it for weekly context; day traders do not, because the three-day lag makes it unsuitable for intraday decisions.
What is smart money in trading?
Smart money refers to institutional participants whose trades reveal informed positioning — Commercial Hedgers in COT data, 13F-filing hedge funds, and corporate insiders filing SEC Form 4. Their combined flow is what MarketTriage surfaces on the Smart Money tracker, blending positioning extremes with institutional accumulation patterns.
What is contrarian trading using COT data?
Contrarian COT trading means positioning against the crowd when Large Speculators reach a 3-year net long or net short extreme — typically a z-score above +2.0 or below −2.0. Historically, these crowded-trade readings in gold, crude oil, and S&P 500 futures have preceded reversals within 4 to 12 weeks.
Continue Learning
Smart Money Tracking
COT + 13F + insider flow combined into one signal view
14 min readPosition Trading System
How to synthesise COT, 13F, Form 4, and regime signals into a multi-month thesis
14 min readLive Insider Tracker
Live SEC Form 4 cluster feed — equities counterpart to COT positioning data
live data readMarket Regime Classification
Six structural states that replace simple buy/sell signals
18 min read13F Filings Explained
Track what the biggest funds are buying and selling
12 min readInsider Trading Signals
When 3+ executives buy their own stock within 90 days
12 min readBest Brokers for Active Traders
Which broker fits institutional-data trading — IBKR, Saxo, XTB & more compared on cost, execution and regulation
15 min readJoin the Founding 300 — get our weekly COT + Smart Money digest →
For informational purposes only. Historical patterns are not indicative of future results. This is not financial advice. MarketTriage provides observational analysis of publicly available regulatory data and does not offer directional trade recommendations. Raw COT data: CFTC.gov. Methodology references: Larry Williams, Stephen Briese.